
Uptinio now includes a personal AI monitor assistant—a chat side panel you can use to create monitors, pause failing checks, summarize incidents, and dig into recent history without bouncing through forms. Alongside it, the dashboard UI has been revamped so uptime, monitors, servers, and status read clearer at a glance.
This is different from our earlier AI-assisted incident analysis. The new assistant is a day-to-day helper for your project: ask in plain English, and it can take actions or report back with context.
Your personal monitor assistant
Open the Sparkles button in the app to chat with the assistant. Describe what you need—create an HTTP monitor, pause failing monitors, summarize ongoing incidents—and it responds in the conversation, including confirmations when it creates or updates resources.
Create monitors in plain English
Ask it to set up an HTTP check for a URL, interval, and related options without filling the form yourself.
Manage and pause
Pause failing monitors or adjust settings when you need a quieter incident window.
Incident summaries
Ask for a short summary of ongoing incidents and what changed recently.
Check history
Review recurring failures and recent check history by monitor so you can spot patterns faster.
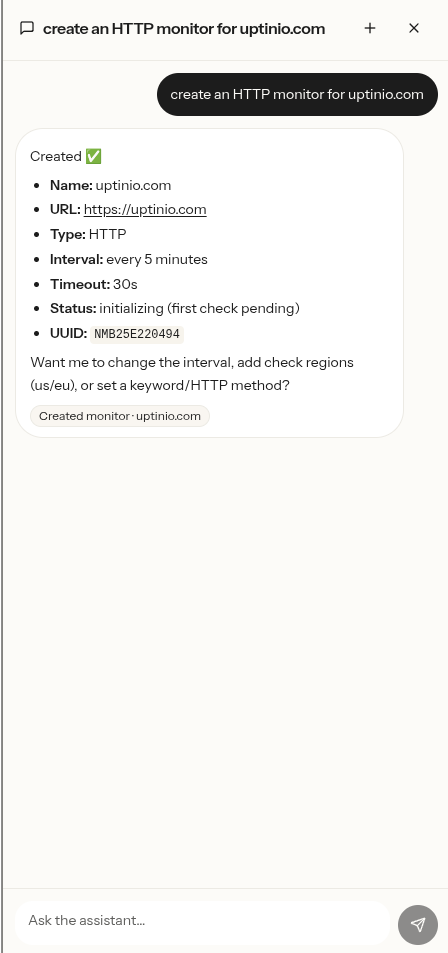
Uptinio AI assistant creating an HTTP monitor for uptinio.com from a plain-English request
Suggestions in the panel include prompts like creating an HTTP monitor, pausing failing monitors, summarizing incidents, and showing recurring failures. Usage is subject to a monthly AI limit shown in the app when you reach it.
Revamped dashboard UI
The dashboard brings monitors, servers, and alerts into one place with a cleaner layout: summary stats for uptime, monitor and server counts, and overall status; a Monitors / Servers toggle; search; and clearer status badges on each row.
Stats at a glance
Uptime, monitor counts, server health, and overall status sit at the top of the page.
Monitors and servers together
Switch between monitor and server lists without leaving the dashboard.
Faster findability
Search by name, URL, or type, then act with Add Monitor when you need a new check.
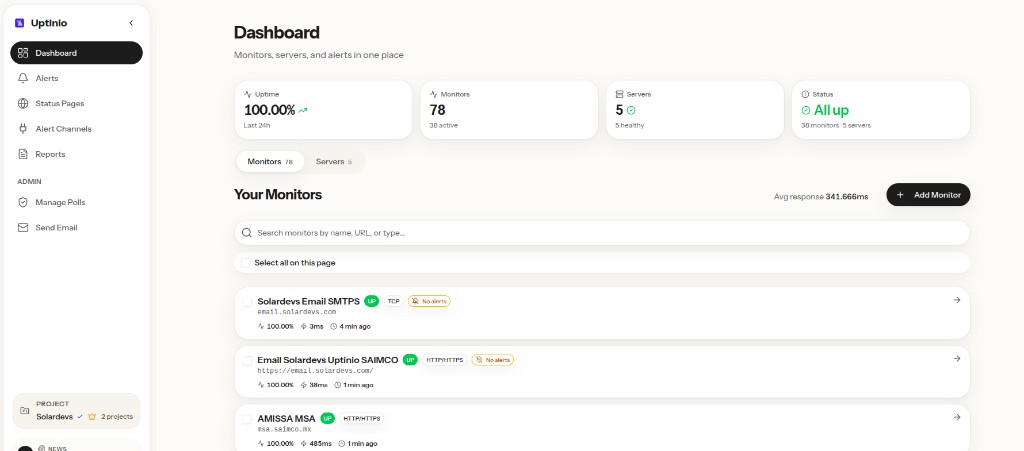
Revamped Uptinio dashboard showing uptime stats, monitors and servers, and clearer status rows
Try it in your project
Sign in, open your project dashboard, and use the assistant button to ask for a monitor or an incident summary. Existing users get the new UI and assistant in the app; if you are new to Uptinio, this is a good time to start.
Related
Ready to try the personal monitor assistant?